Crunching the numbers on 30by30
The Government recently published the draft map showing how the goal of of 30% of land and sea managed for nature by 2030 can be delivered: Delivering 30by30 on Land in England, along with the proposed criteria for how land can count towards the target.
The National Landscapes Association's Bruce Winney crunches the numbers.
The recent publication of a draft 30by30 map (the goal of 30% of land and sea managed for nature by 2030) for England, Delivering 30by30 on Land in England, along with the proposed criteria for how land can count towards the target is something to be welcomed. It gives us an idea of how much work is needed and where the gaps are likely to be.
The positives first:
There are some good things here. The three overall criteria of Purpose, Protection and Management are logical and it is pleasing to see that Management includes monitoring – this is a crucial piece of the jigsaw that must not be forgotten.
Their approach of identifying land that has the potential to contribute to 30by30 and then reporting on what actually does count is sensible. It is also how we have been thinking about 30by30 in the National Landscapes.
From the point of view of the National Landscapes, and indeed, the National Parks, Defra recognise that these Protected Landscapes will have an important role to play but, crucially, that it won’t be possible to count the entirety of an individual National Landscape. This is important because over 60% of National Landscapes land is farmed and this includes a lot of high-quality agricultural land.

But:
There are a couple of issues that do need to be addressed. One has been picked up by a number of commentators and the other one seems to have gone unnoticed.
As many have pointed out, the draft comes up with a figure of 8.5% of land in England that can count towards the target but that this includes all Sites of Special Scientific Interest (SSSIs). SSSIs are the core of the UK’s conservation strategy but they are generally not in a good state, with only 36% in ‘Favourable’ condition.
This immediately defies many of the draft’s suggested management criteria metrics.
Even the sites in ‘Favourable’ condition could well miss these criteria given that many of the assessments are very old and a number will be downgraded the next time they are assessed. It might be a bit mean to exclude them, so we could count SSSIs in ‘Favourable’ condition. We could also count those SSSIs that are in ‘Unfavourable Recovering’ condition as long as they are in current agri-environment schemes. For SSSIs, these are generally 10-year schemes and suggest that the landowner is trying to do something.
Limiting SSSIs that count to these two categories means that a more realistic assessment of land that can count through SSSIs is 3.1%. This reflects Wildlife and Countryside Link’s work. Add in the 0.7% from woodland under management and National Nature Reserves and we get to a total of 3.8%, which is probably more realistic than 8.5%.
Now for the big one for National Landscapes and please bear with me including figures but this is important.
If you look at the numbers in their table, the draft map identifies land that covers 26.8% of England that has the potential to count towards 30by30.
15.6% is expected from Protected Landscapes. Add the 4.4% of England’s SSSIs that are within Protected Landscapes and that suggests that two thirds of the target (20%) could be met by Protected Landscapes.
Protected Landscapes cover 24.5% of England and to meet that 30by30 ask, 81% of land inside Protected Landscapes would need to count. Given that across all Protected Landscapes, 52% of land is farmland, and that agricultural land that Is actively farmed cannot qualify for30by30, this would require significant land-use conversion from farming. Raw numbers suggest that 64% (about 1m hectares) of farmland would need to be converted.
We do need to be ambitious but also need to consider other land-use needs and realise that there are differences across Protected Landscapes. These differences can, broadly speaking, be summarised by splitting them into lowland, with 70% or more land farmed, and upland, with much less farming and generally lower quality agricultural land.
We are looking in detail at how six of our National Landscapes might be able to contribute to 30by30 and this work is beginning to show how we could be ambitious. By understanding what land could potentially count, an ambitious, but realistic, contribution from lowland National Landscapes could be in the region of 35%, with upland National Landscapes in the region of 60%. This is a lot less 81% but would mean that a quarter of England (the Protected Landscapes) could still contribute 12.5% of England’s land to the 30by30 target.
Add in 3.4% of SSSIs outside Protected Landscapes, woodland, Local Nature Reserves and other bits suggested by the paper and we come to a further 11.3%, in an area that covers three quarters of England. So, we are now about 2.8% short.
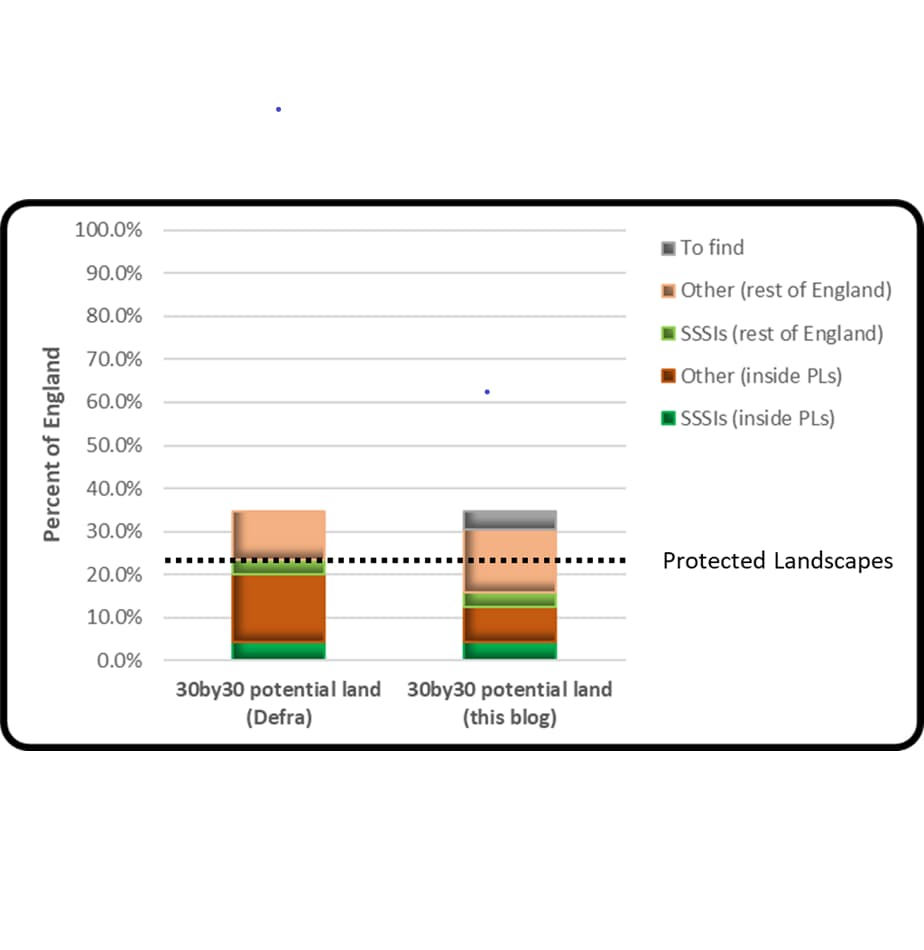
An important part of the jigsaw that we are missing is the network of Local Wildlife Sites. These will be important components of the upcoming Local Nature Recovery Strategies but, because of licencing issues, Natural England have not included them on the map. Our work suggests that there might be something like a further 2-5% of England that could contribute to 30by30 through these. All of this can be summarised visually. For reference, the dotted line represents the 24.5% of England’s land that Protected Landscapes cover:

We do need to go further and, indeed, Defra recognise that there is unmapped land from private landowners and eNGOs that could be included. The potential can add up - the hard work will be getting the land fit for nature.
We should also remember that 30by30 is only one of a number of tools and our vision is that National Landscapes will contribute significantly to nature recovery through a 30by30 approach in a wider landscape, which will allow the critical ecological connectivity that is needed if nature is to both thrive and adapt to a climate changing world.
A landscape approach also allows connectivity across landscapes (eg. The Great North Bog). Without connectivity, 30by30 won’t work and it is important that the land outside Protected Landscapes is included. This can be achieved by regional programmes such as Big Chalk, which covers 19% of England, but also needs areas without such programmes in place to contribute. We must join up across white spaces in the proposed 30by30 map.
